
This tutorial takes one sequencing run from a public archive to a full quality report, using only a phone. You will:
- Find the run in the Sequence Read Archive.
- Download its FASTQ files.
- Summarize the reads in Complete mode.
- Read the report: quality, composition, duplication, and adapters.
Before you start
Section titled “Before you start”- A phone or tablet with Android 8.0 or newer, or iOS or iPadOS 15.0 or newer.
- SEGUI v1.2.0 or newer. See GUI installation.
- About 500 MB of free storage: 238 MB for the download and the same again for SEGUI's working copy.
- Wi-Fi. The two files add up to 238 MB.
The dataset
Section titled “The dataset”The data are the raw reads of one sample from Esselstyn et al. 2017, a study of the placental mammal tree based on ultraconserved elements (UCEs). The sample is a short-tailed gymnure, Hylomys suillus, from the Field Museum (FMNH 168652).
| Run | SRR6053059 |
| BioProject | PRJNA390442 |
| Library | UCE target enrichment, paired-end |
| Instrument | Illumina HiSeq 3000 |
| Reads | 1,761,846 pairs, 125 bp each |
| Files | SRR6053059_1.fastq.gz, 119 MB, and SRR6053059_2.fastq.gz, 119 MB |
1. Find the run
Section titled “1. Find the run”Reads submitted to GenBank's Sequence Read Archive (SRA) get a run accession that starts with SRR. A paper lists either the runs or a BioProject that groups them.
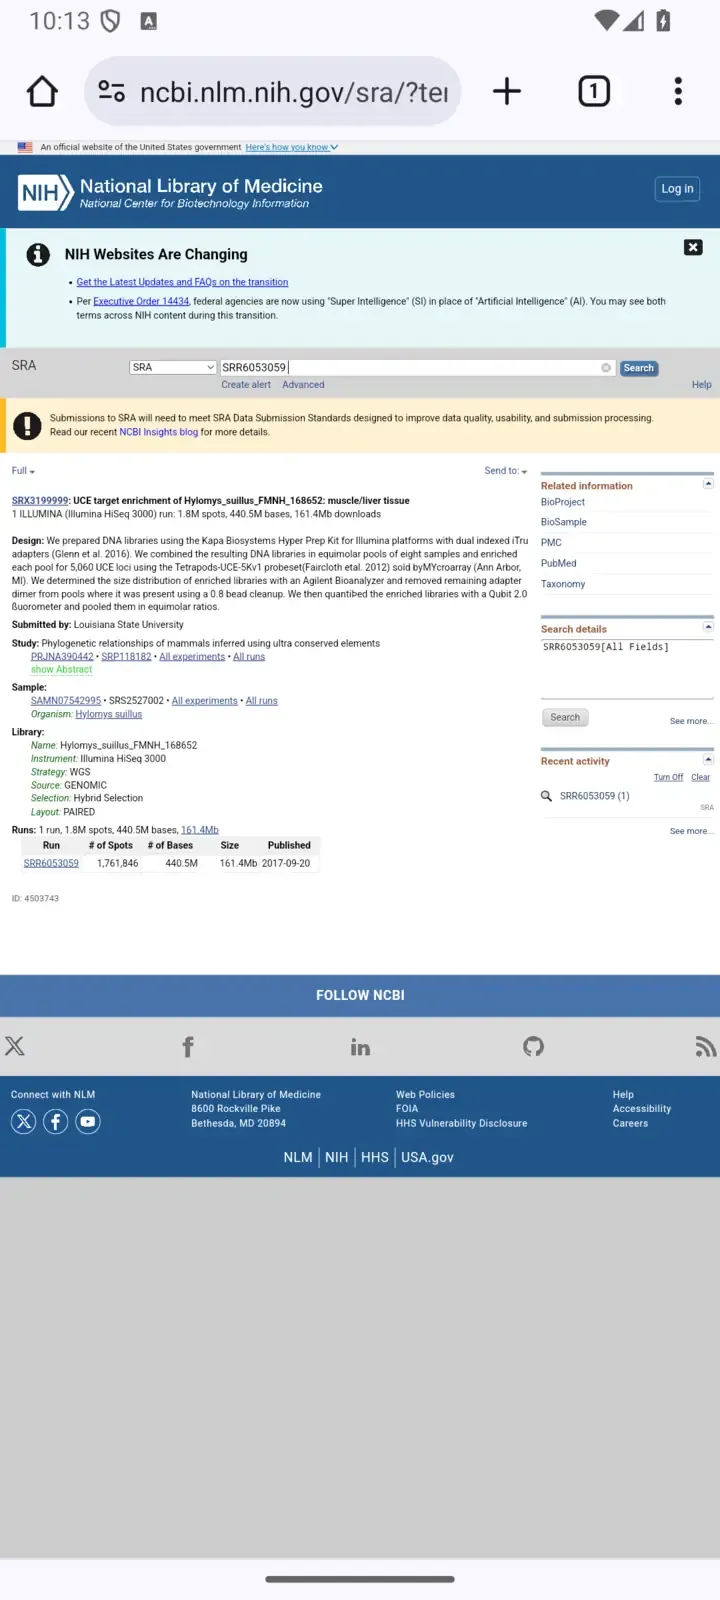
- Open the SRA record of SRR6053059 in your browser.
- Check the record: the organism is Hylomys suillus, the layout is PAIRED, and the run has 1.8M spots and 440.5M bases. A spot is one read pair.
- Note the run accession,
SRR6053059. The same accession finds the run in every archive that mirrors the SRA.
2. Download the reads
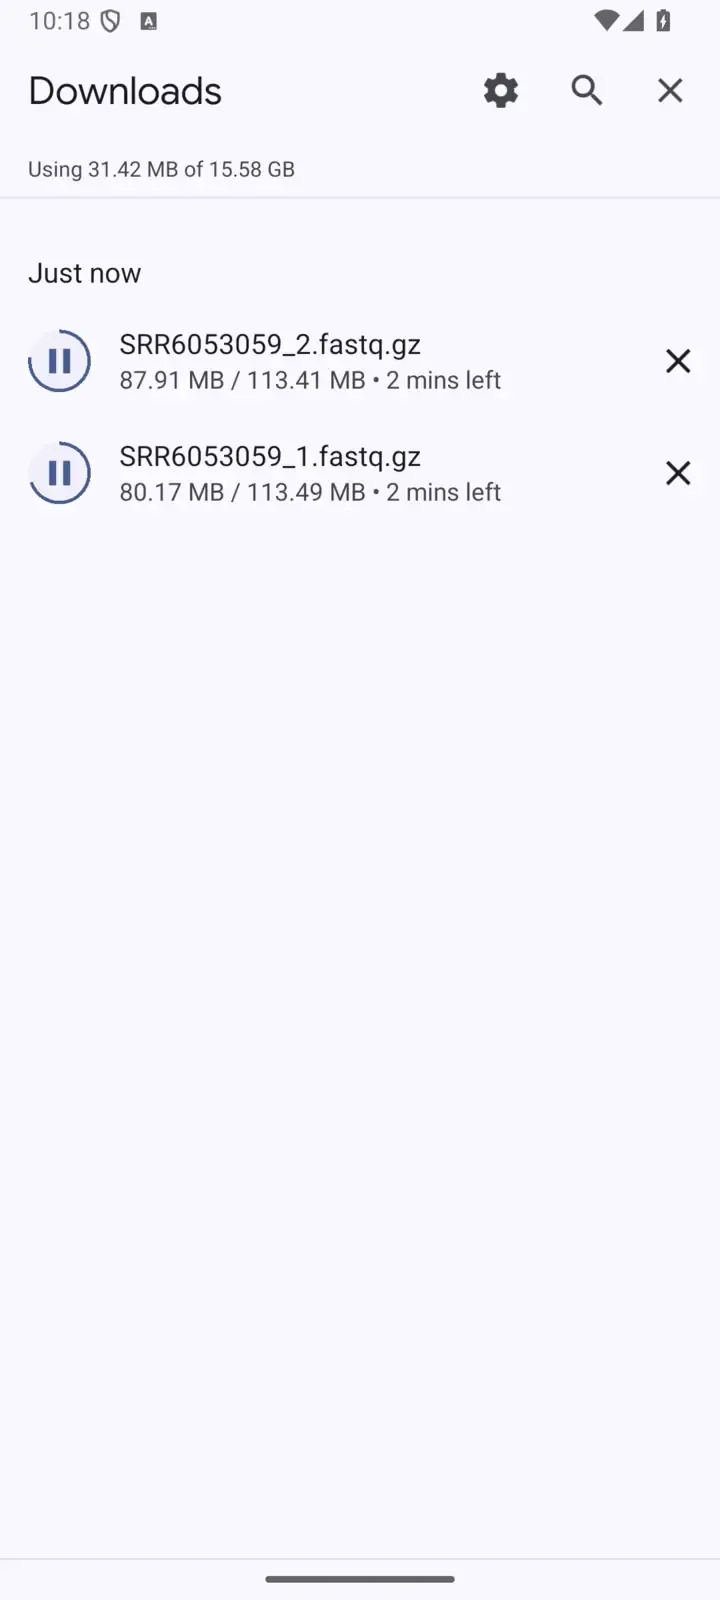
Section titled “2. Download the reads”- In Chrome, tap SRR6053059_1.fastq.gz. The download starts.
- Tap SRR6053059_2.fastq.gz.
- To follow the progress, open the Chrome menu and select Downloads.
- Chrome saves both files to the Downloads folder. Wait for both to finish. You do not need to open or extract them.
- In Safari, tap SRR6053059_1.fastq.gz, then select Download.
- Tap SRR6053059_2.fastq.gz, then select Download.
- Safari saves both files to the Downloads folder in the Files app, in iCloud Drive or On My iPhone. Do not tap the files there: Files would extract them, and SEGUI reads them compressed.
3. Summarize the reads
Section titled “3. Summarize the reads”Open the tool and add the reads
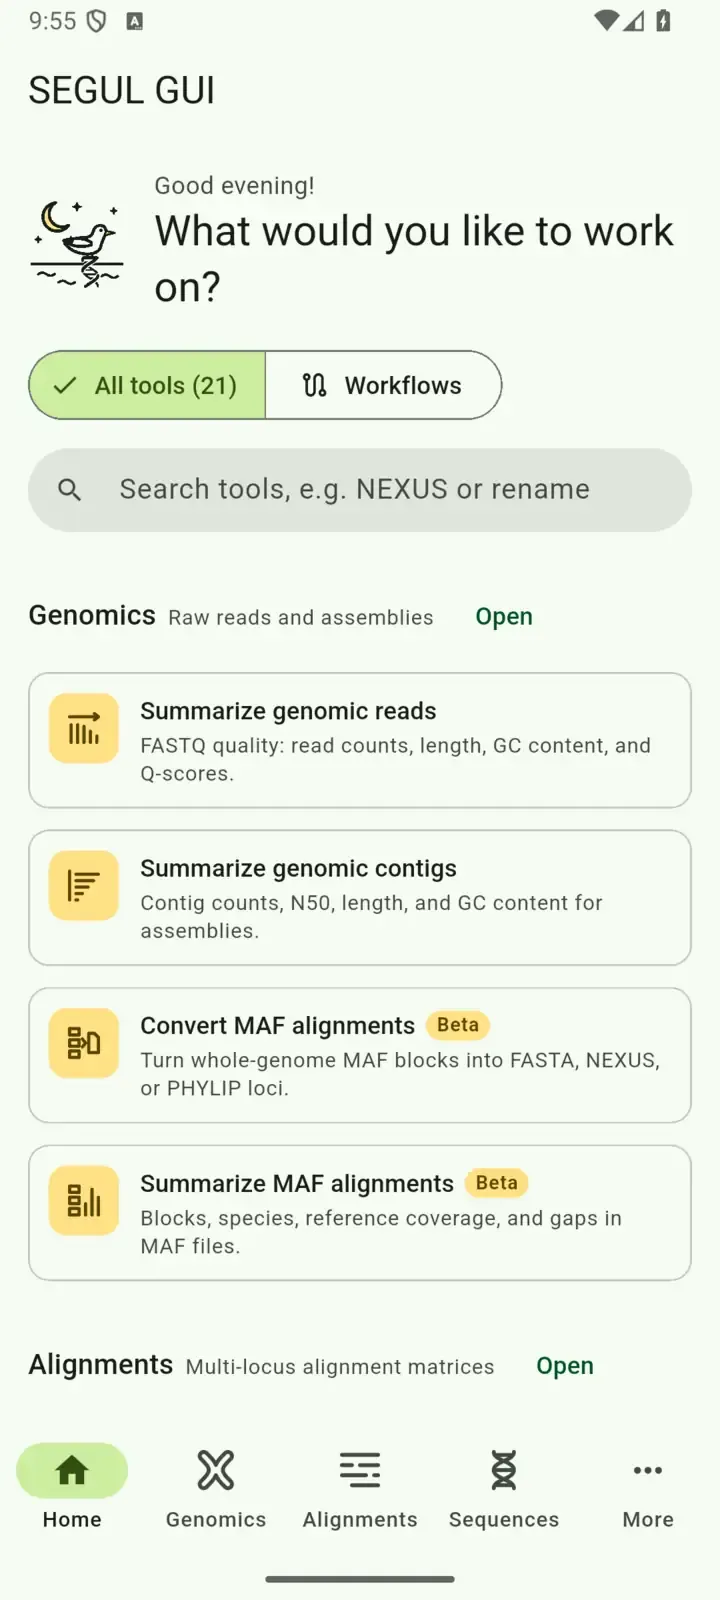
Section titled “Open the tool and add the reads”Open SEGUI. On the home screen, select Summarize genomic reads.
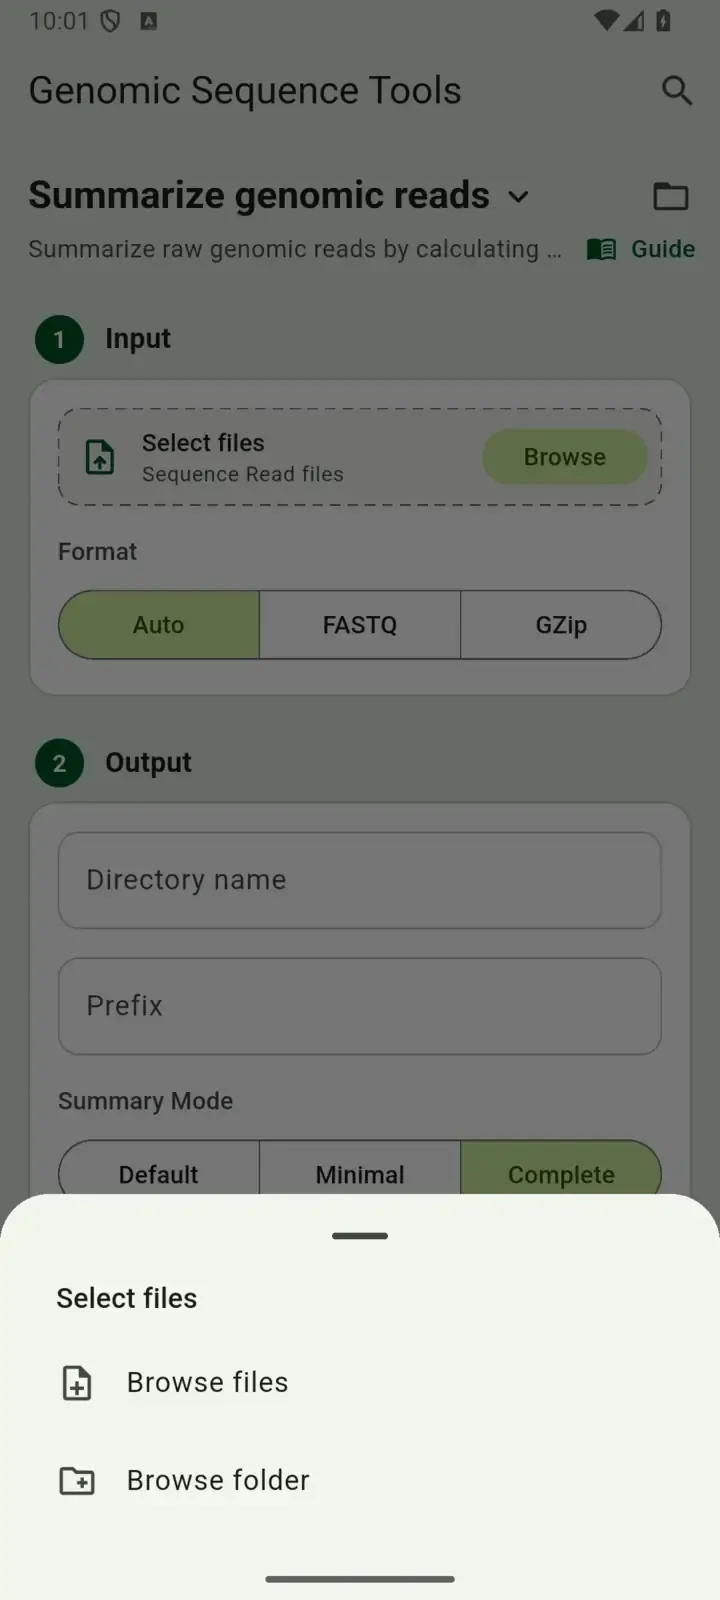
In the Input card, select Browse, then Browse files.
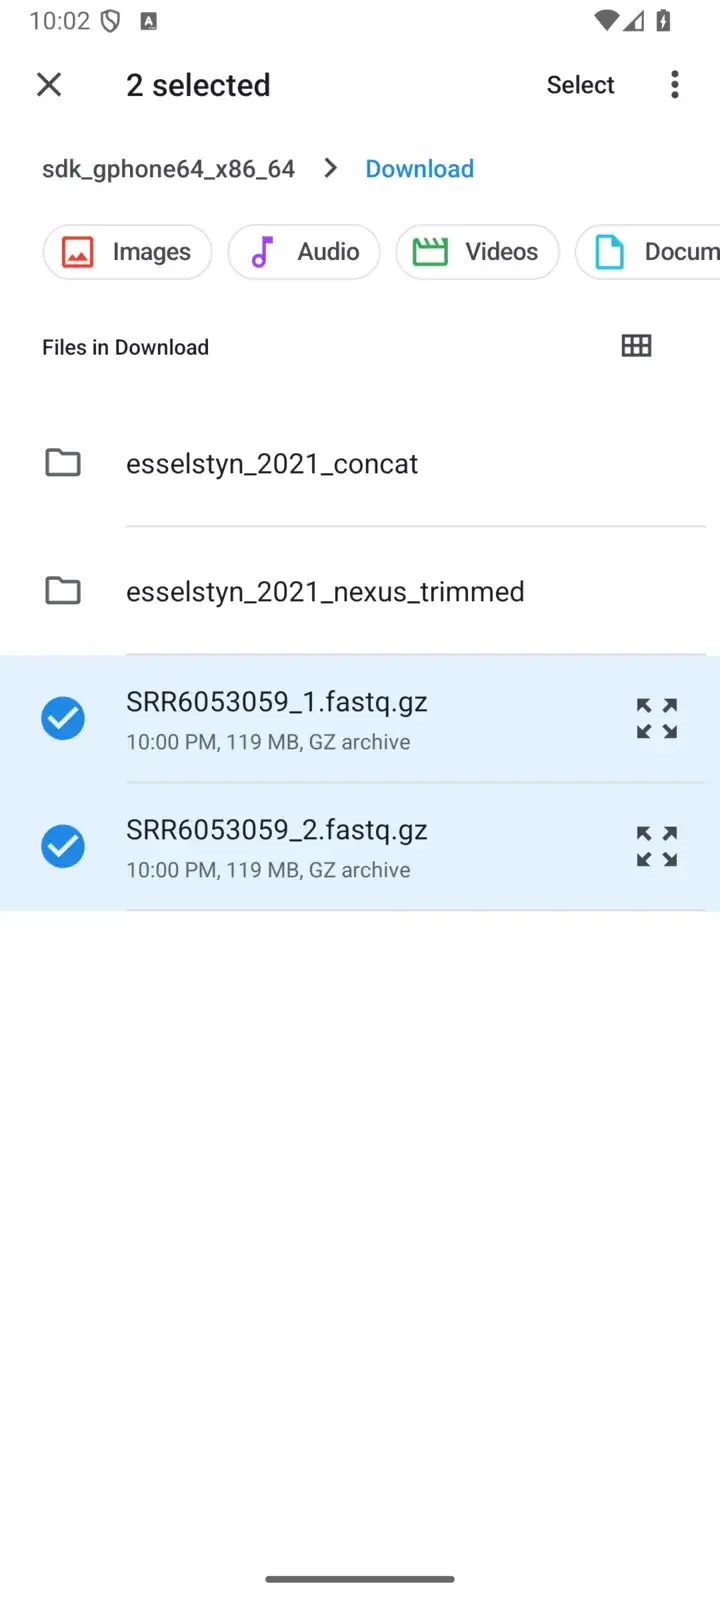
Pick both FASTQ files:
In the system file picker, open the menu and select Downloads. Touch and hold
SRR6053059_1.fastq.gz, tapSRR6053059_2.fastq.gz, then tap Select.In the Files picker, select Browse and open Downloads. Tap both files, then tap Open.
Wait while SEGUI copies the files. The input card then shows 2 files selected.
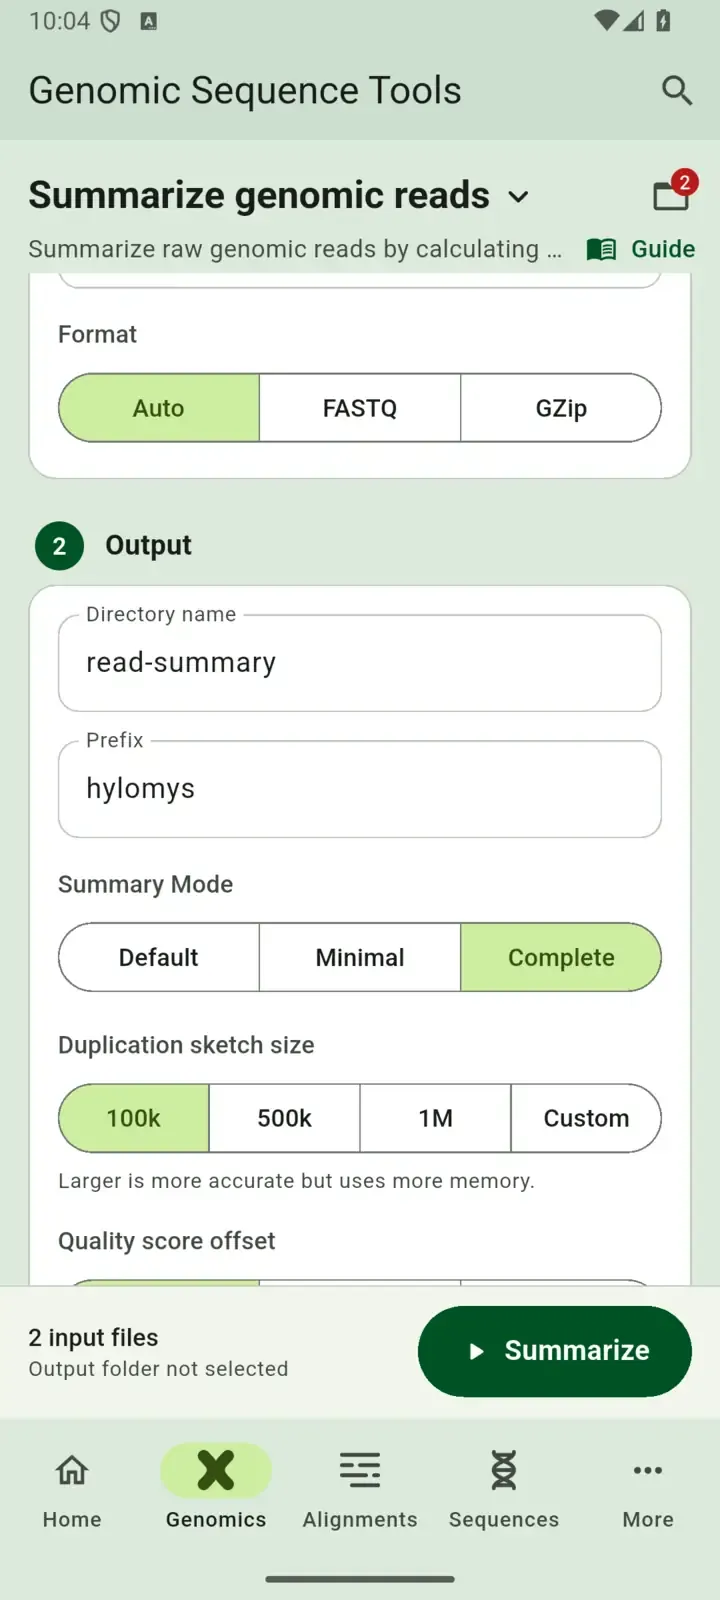
Leave Format on Auto.
Set the output and run
Section titled “Set the output and run”- In the Output card, enter a Directory name, such as
read-summary. - Enter a Prefix, such as
hylomys. It starts the name of each output file. - Leave Summary Mode on Complete. Only this mode writes the read report.
- Leave Duplication sketch size on 100k and Quality score offset on Auto.
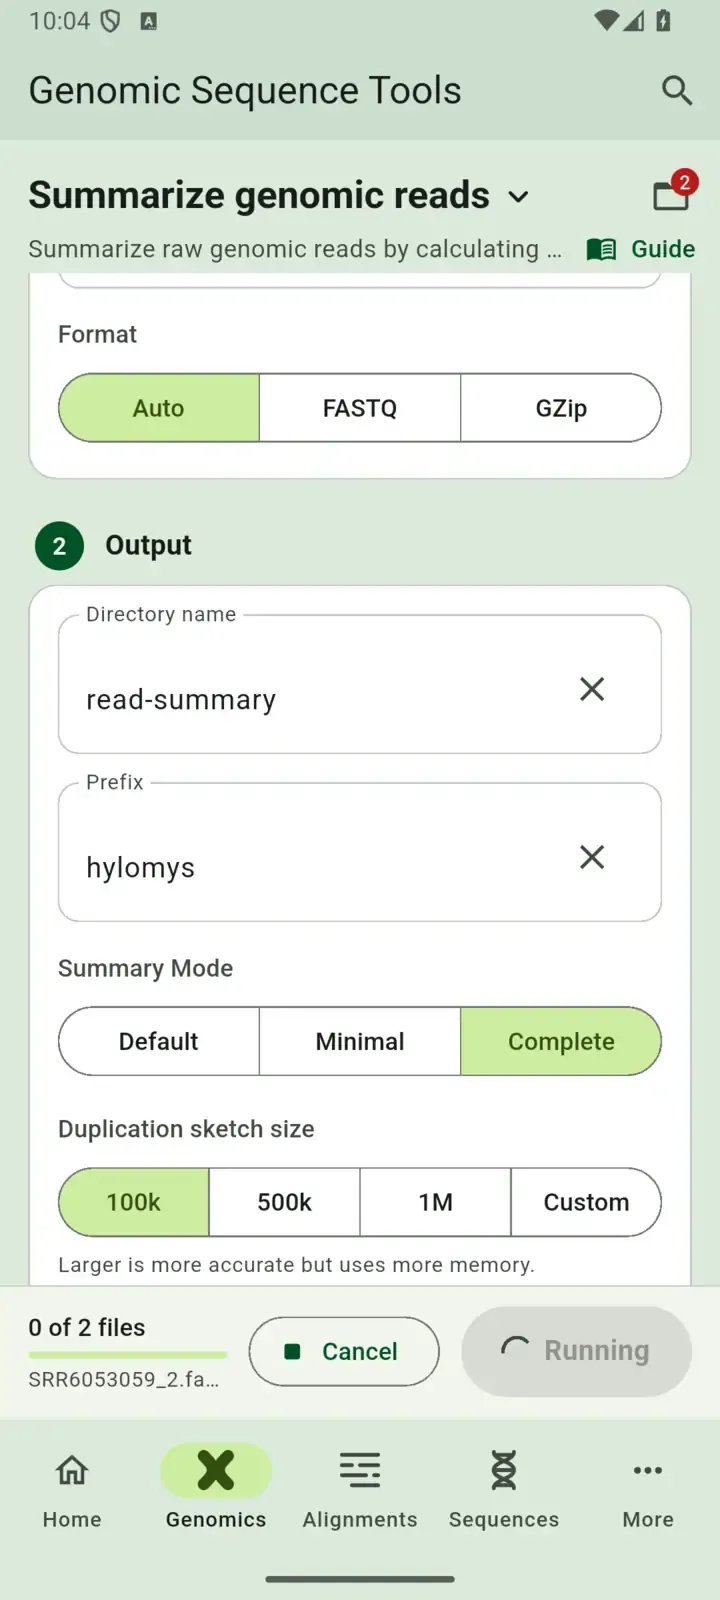
- Select Summarize.
The run takes a few seconds. SEGUI then opens the Workbench tab, with 2 input files and 4 output files.
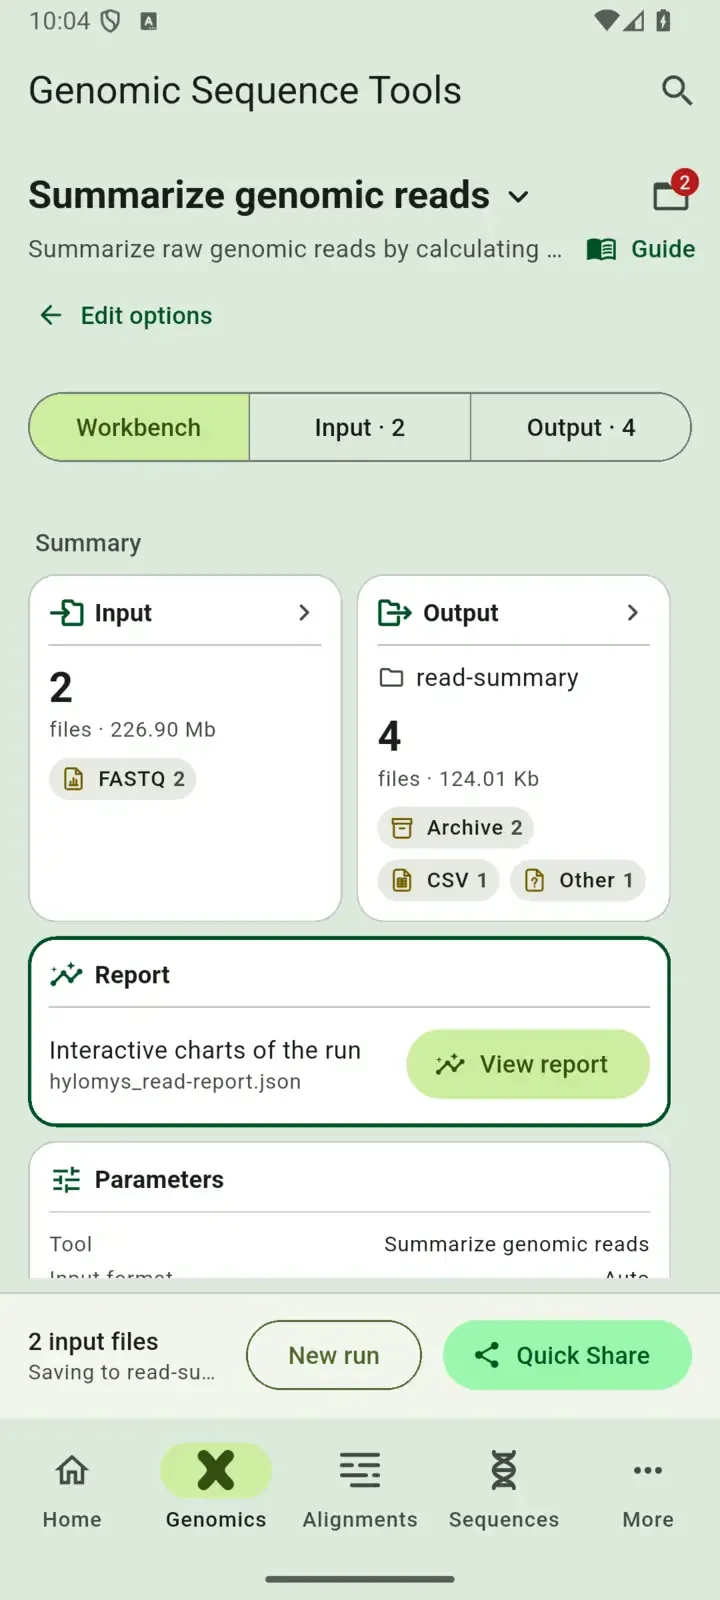
The output files are:
hylomys_default-read-summary.csv: one row of statistics per file.hylomys_read-pos-summary.zipandhylomys_read-dist-summary.zip: tables per read position and distributions for each file.hylomys_read-report.json: the read report.
4. Read the report
Section titled “4. Read the report”Select View report on the Report card. The report shows one file at a time. The two files are the two directions of the same read pairs, so inspect both.
Start with the checks
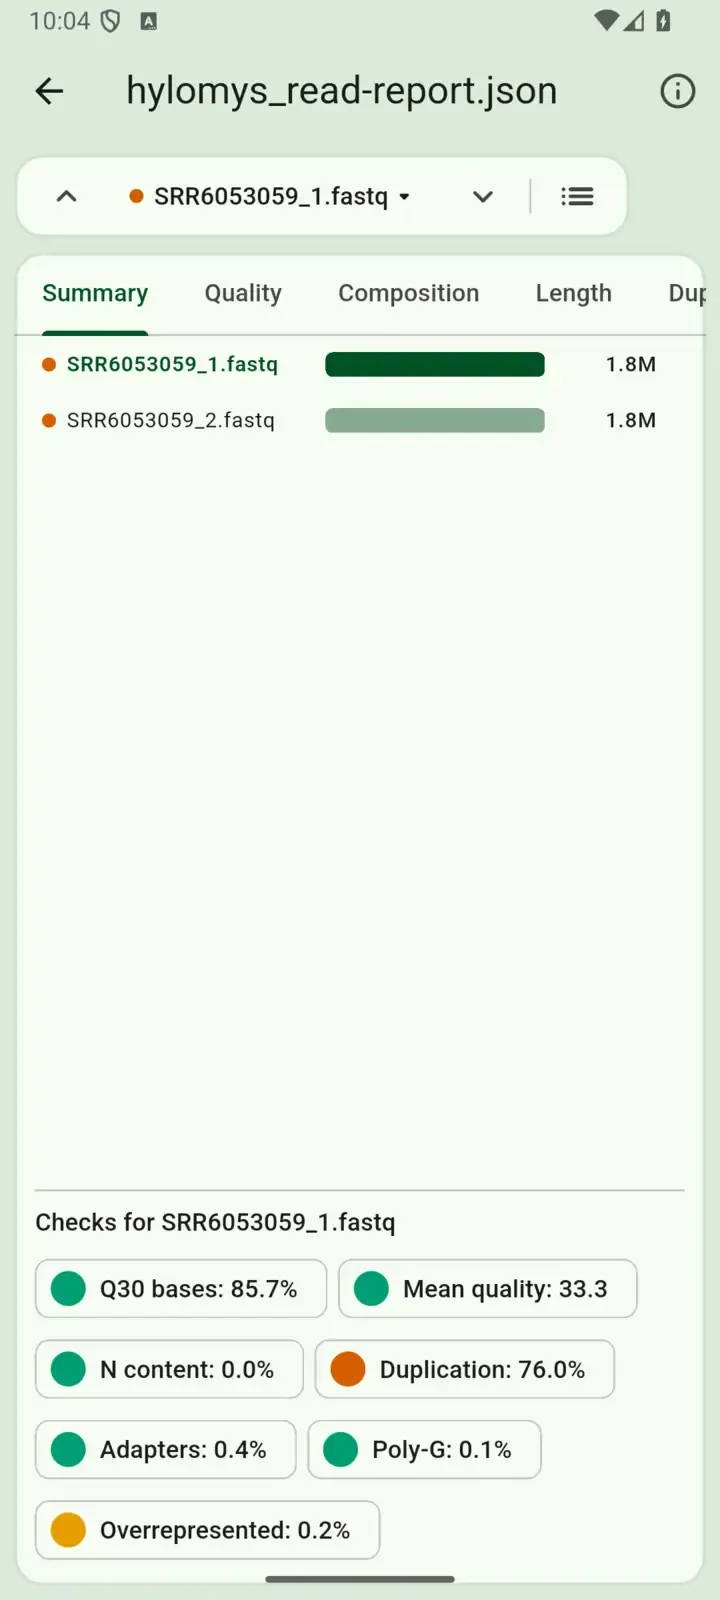
Section titled “Start with the checks”The Summary tab lists both files with their read counts. Scroll down to the checks of the open file. Each one is marked pass, warn, or fail.
| Check | SRR6053059_1 | SRR6053059_2 |
|---|---|---|
| Q30 bases | 85.7% | 83.2% |
| Mean quality | 33.3 | 32.6 |
| N content | 0.0% | 0.1% |
| Duplication | 76.0% | 73.7% |
| Adapters | 0.4% | 0.4% |
| Poly-G | 0.1% | 0.1% |
| Overrepresented | 0.2% | 0.2% |
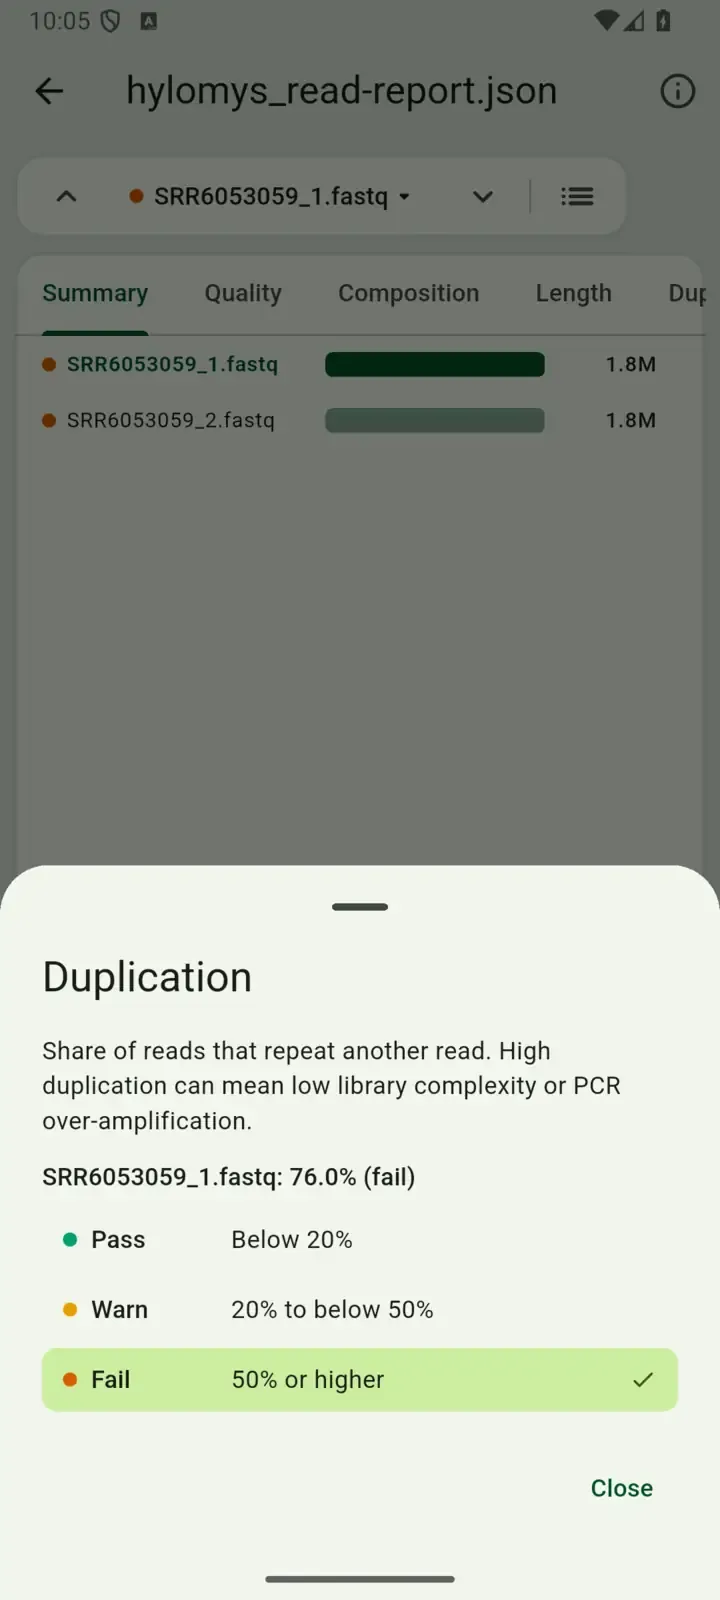
Quality, N content, adapters, and poly-G pass. Duplication fails and overrepresented sequences get a warning. Tap a check to see what it measures and its thresholds.
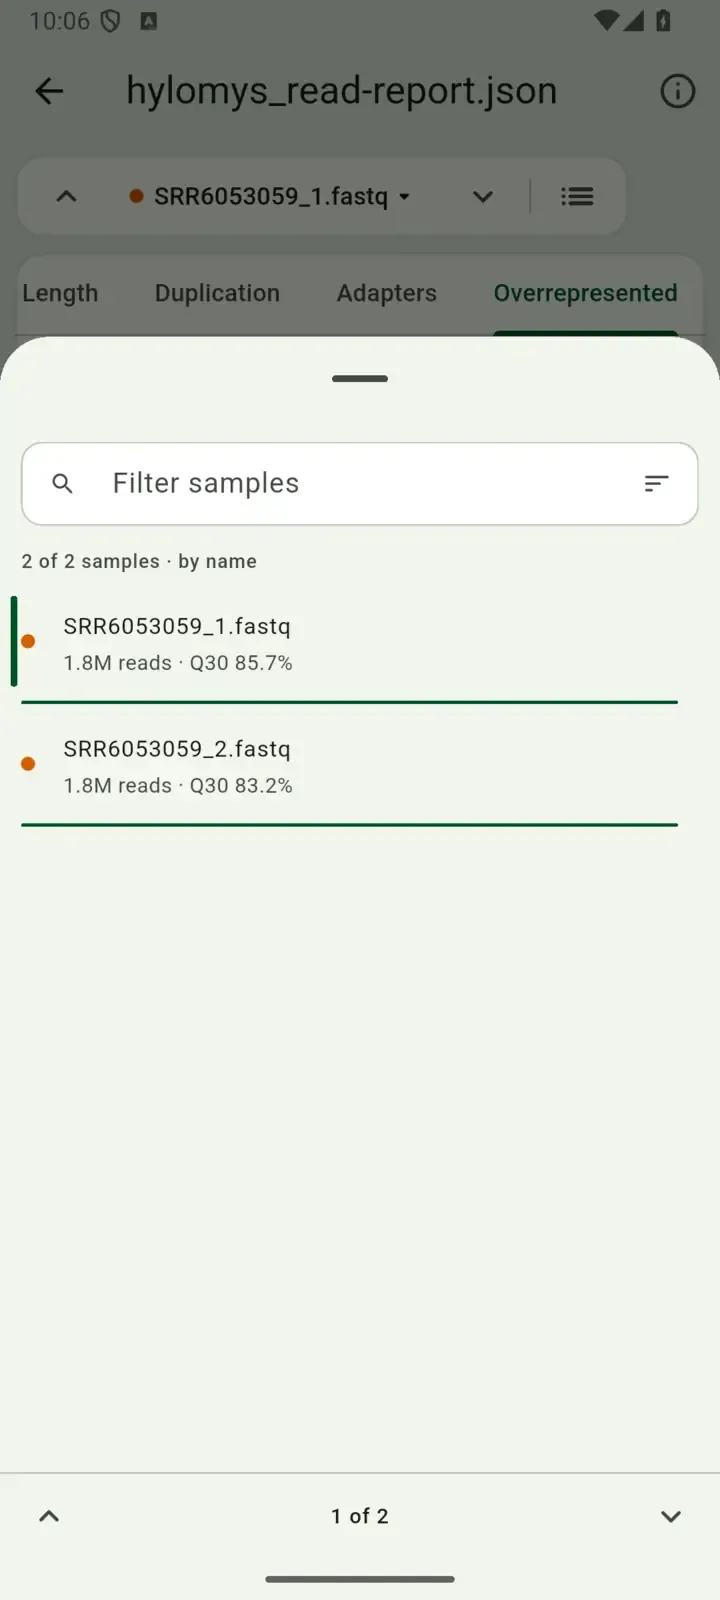
To open the other file, use the arrows next to the file name, or the list button to see both files with their reads and Q30 bases. For every statistic side by side, tap the settings button above the bars and select Table.
Quality
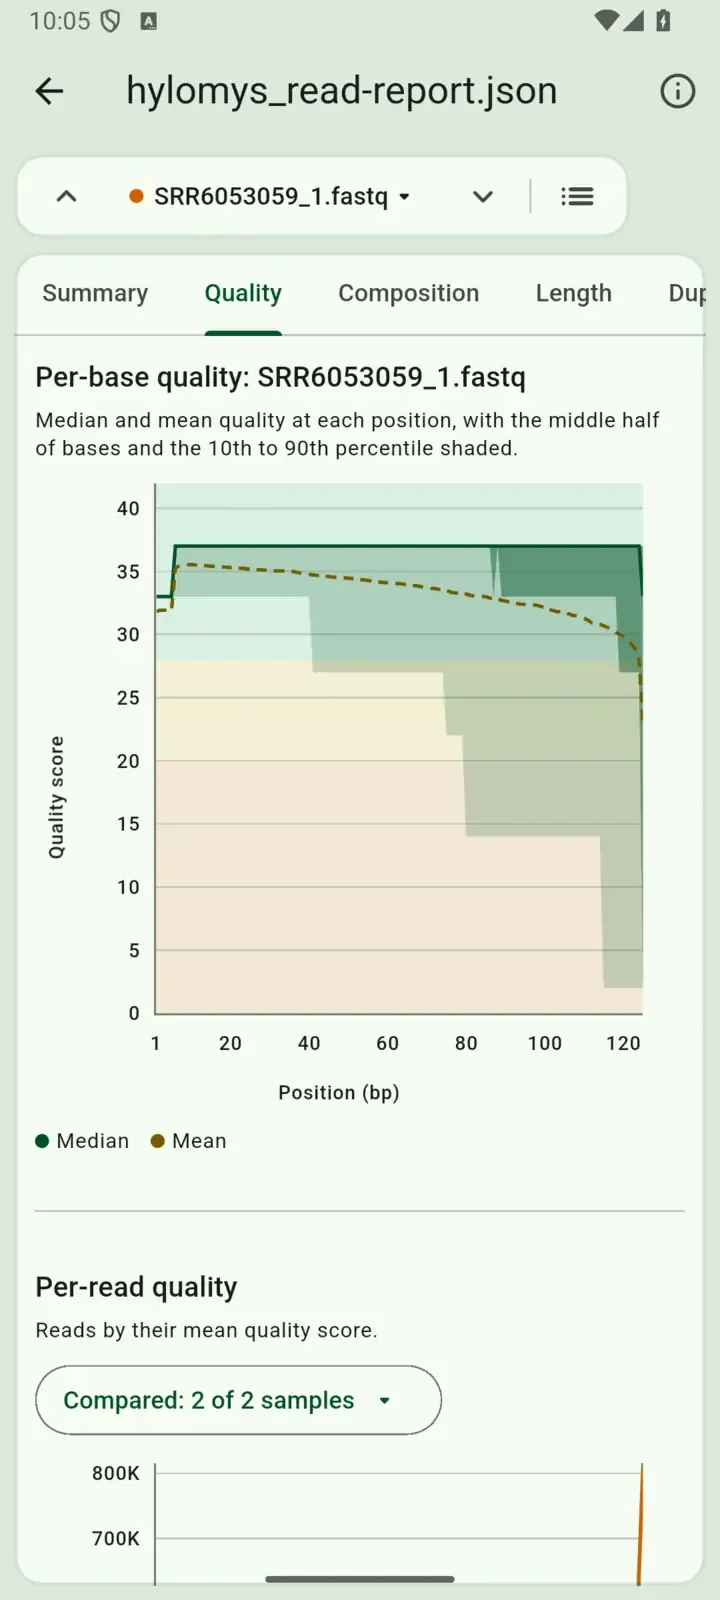
Section titled “Quality”Open the Quality tab. The per-base quality chart plots the quality score at each position of the read, over green, yellow, and red zones for good, reasonable, and poor quality.
- The median stays at 37 from position 6 to 124, well inside the green zone.
- The mean falls slowly, from about 35 near the start to 30 at position 120, then drops to 23 at the last base.
- The shaded band shows the 10th percentile. It reaches a score of 2 at position 115 in the first file and at position 107 in the second.
So most bases are good, but a share of reads have poor ends, and the second file is slightly worse than the first. Both are typical of Illumina paired-end runs. The bands move in steps because this instrument reports only a few quality values.
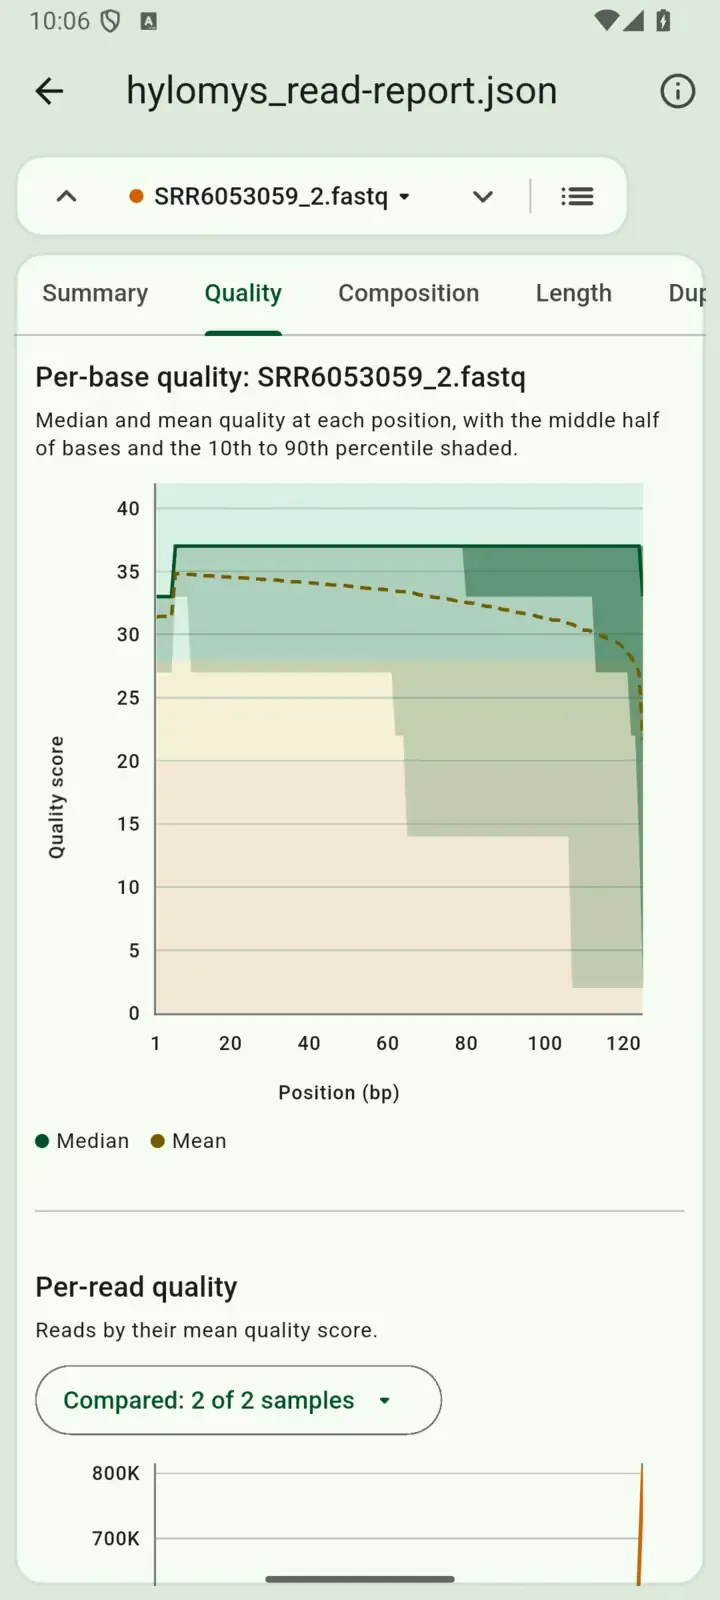
Scroll down to Per-read quality, which compares both files. Most reads have a mean quality above 30. In total, 82,824 reads of the first file and 118,992 of the second have a mean quality below 20, or 4.7% and 6.8%.
Composition
Section titled “Composition”Open the Composition tab.
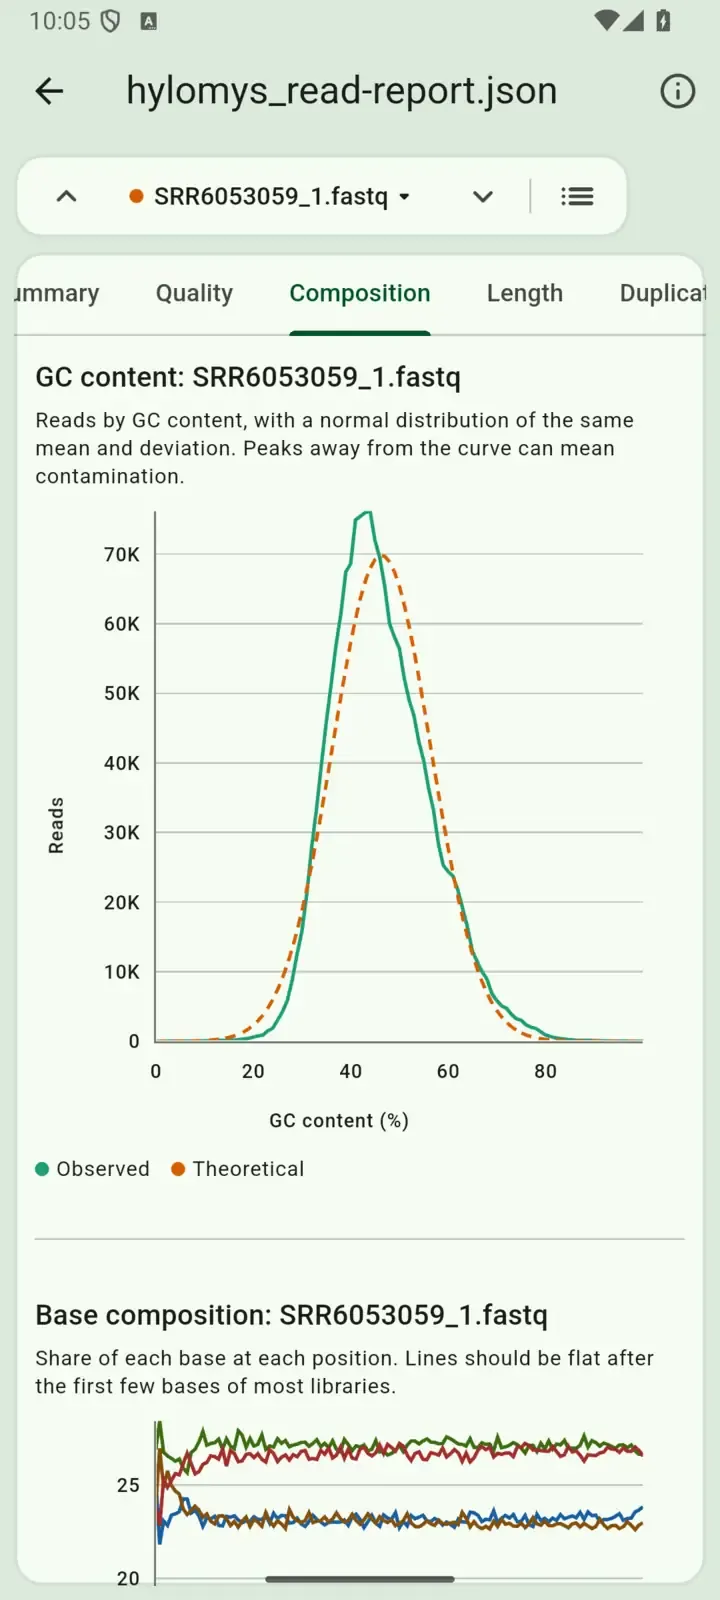
- GC content: the reads average 46.3% GC, and their distribution follows the theoretical curve closely. A second peak would point to contamination.
- Base composition: the four lines are flat after the first few bases, as expected of a random library.
- N content: the sequencer could not call 0.01% of the bases in the first file and 0.13% in the second.
Touch a chart to read its values, and pinch to zoom.
Duplication, adapters, and overrepresented sequences
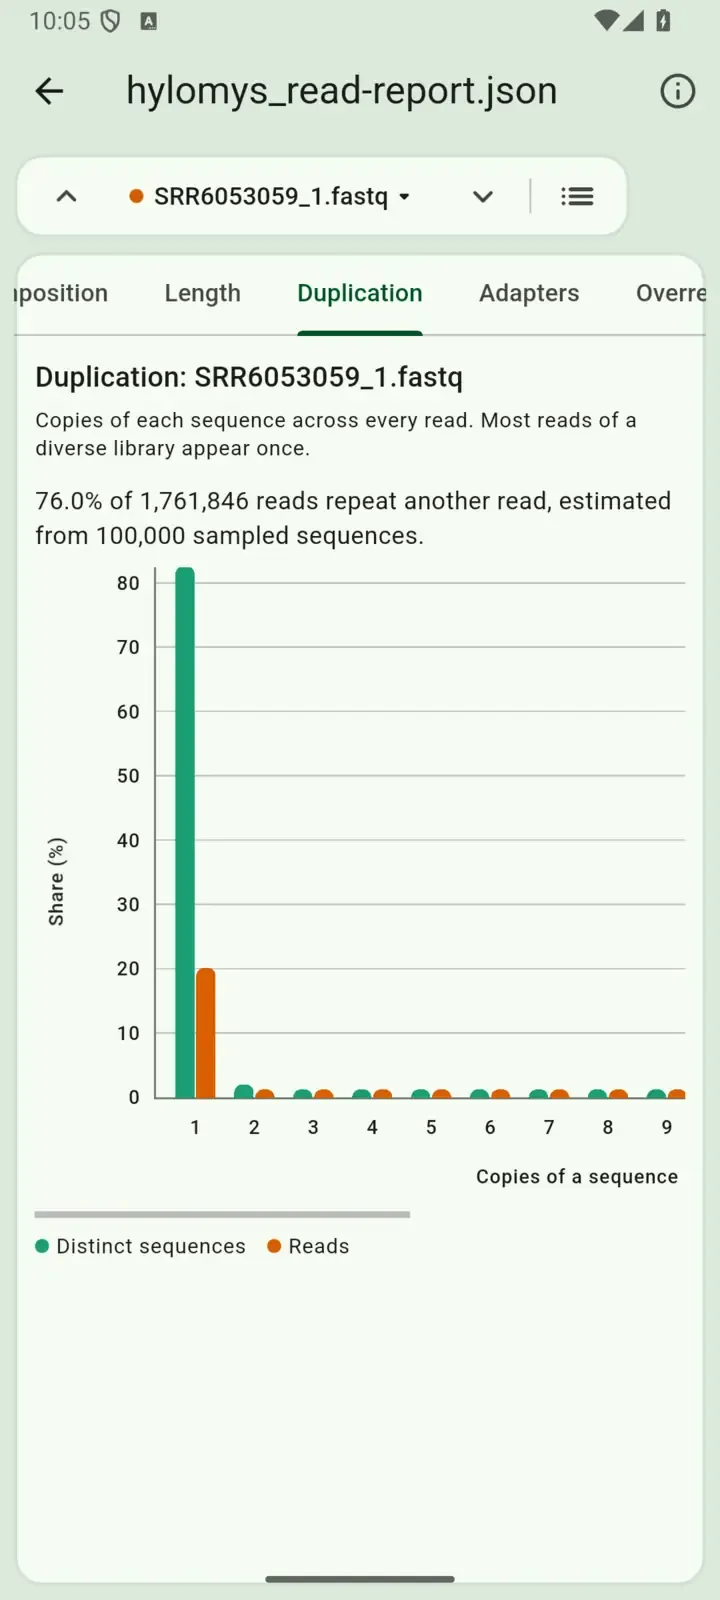
Section titled “Duplication, adapters, and overrepresented sequences”- Duplication: 76.0% of the reads in the first file repeat another read. This fails the check, but it is common in target enrichment libraries, which sequence a small part of the genome many times after PCR. Remove duplicates before calling variants, or let the assembler handle them.
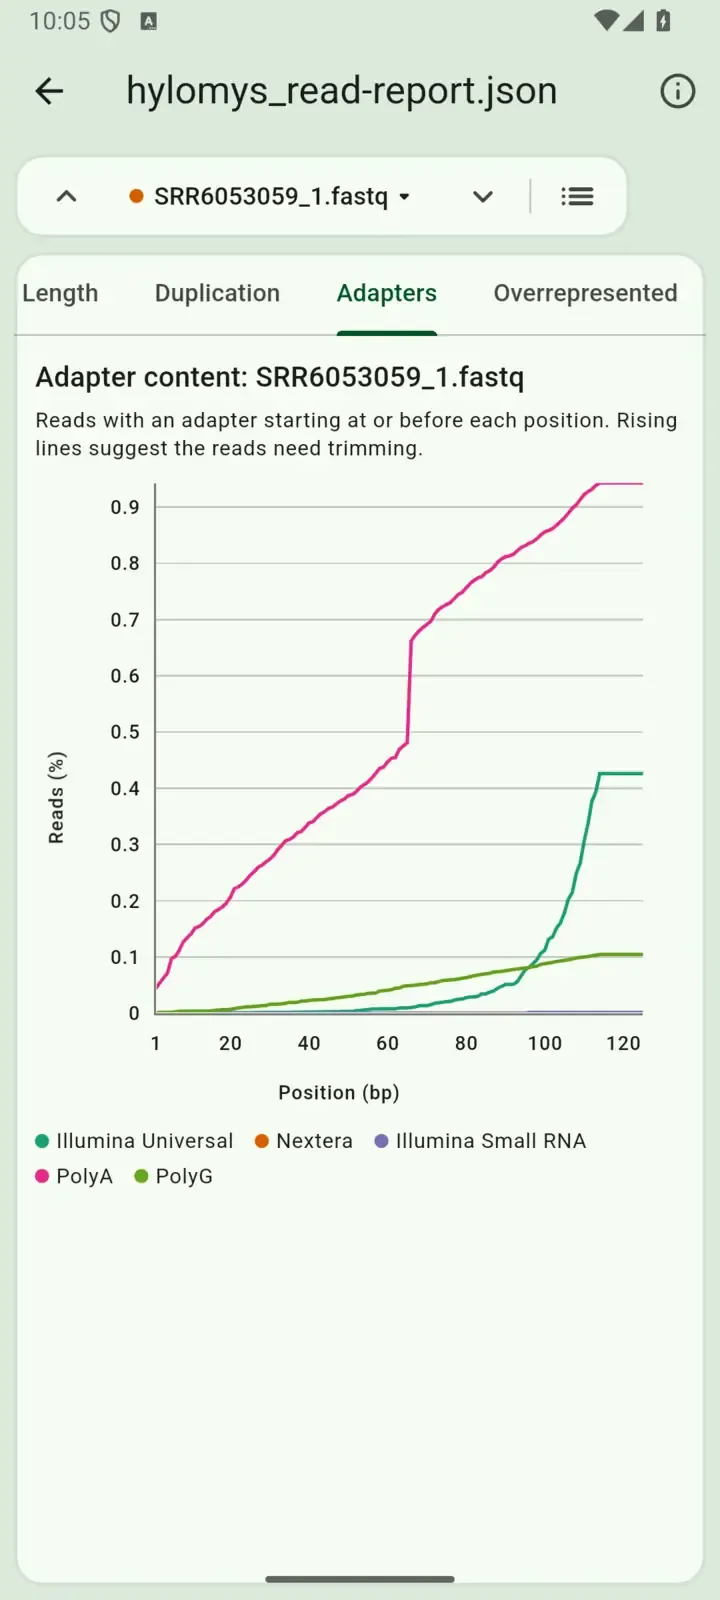
- Adapters: the Illumina Universal adapter is found in 0.4% of the reads, mostly from position 100 onward, where short fragments run out. The line is low, but it rises, so trim the reads before assembly.
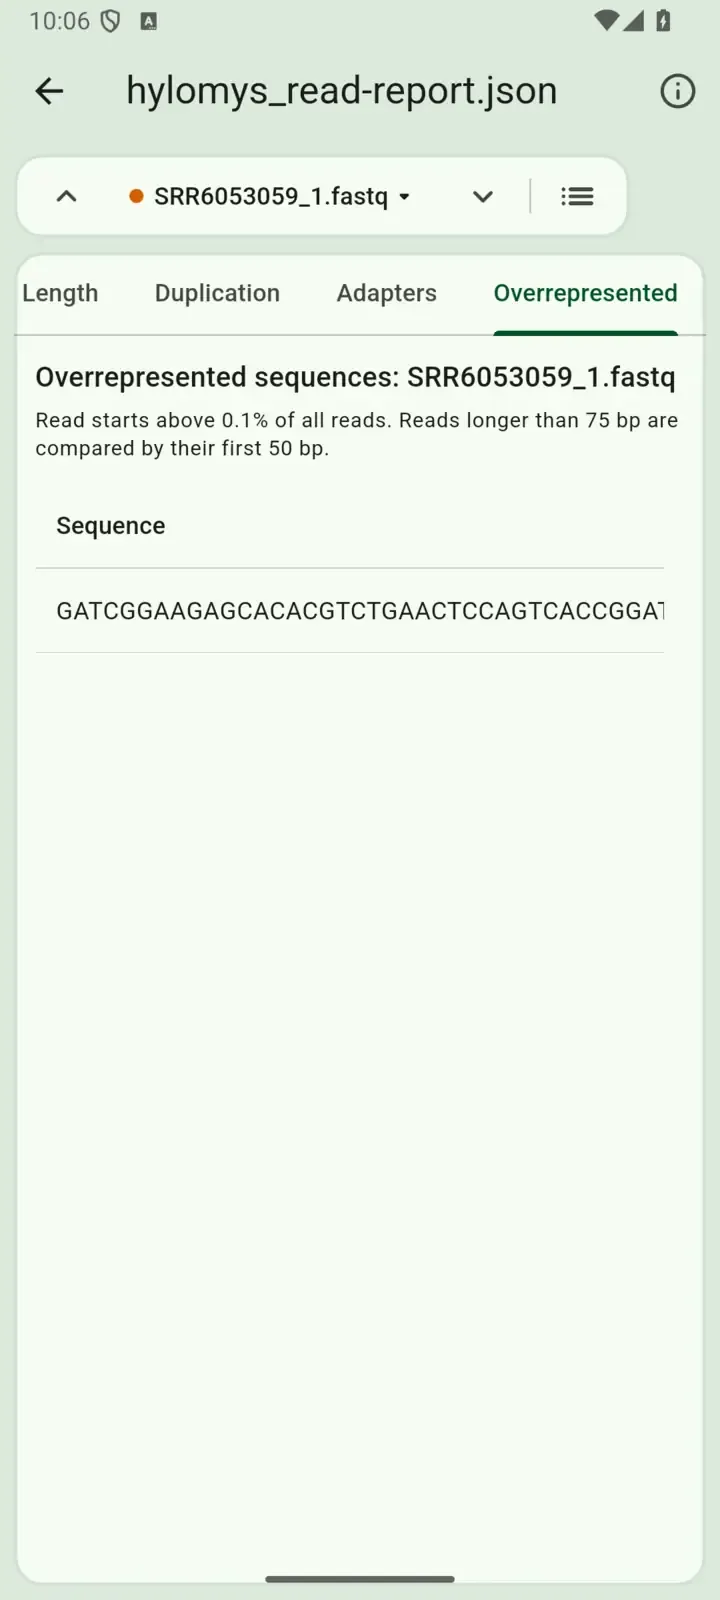
- Overrepresented: one sequence makes up 0.2% of each file. Both start with
GATCGGAAGAGC, which is Illumina adapter sequence. These are reads of adapters with almost no insert, and trimming removes them. Use the copy button to search for a sequence elsewhere.
The Length tab has little to show here: every read is 125 bp, because the reads are untrimmed.
What you found
Section titled “What you found”| Statistic | SRR6053059_1 | SRR6053059_2 |
|---|---|---|
| Reads | 1,761,846 | 1,761,846 |
| Bases | 220,230,750 | 220,230,750 |
| Read length | 125 bp | 125 bp |
| GC content | 46.3% | 46.4% |
| Mean quality | 33.3 | 32.6 |
| Q20 bases | 90.7% | 88.5% |
| Q30 bases | 85.7% | 83.2% |
| Reads with mean quality below 20 | 82,824 | 118,992 |
| Duplication | 76.0% | 73.7% |
| Reads with adapters | 0.4% | 0.4% |
The run is good enough to use: both files have the same number of reads, more than 83% of the bases reach Q30, and there is no sign of contamination. Before assembly, trim the adapters and the low quality read ends.
To keep the results, select the back arrow, then Quick Share on the Workbench tab. See exporting output. For every chart and control of the report, see the read report guide.
The same summary runs from the command line with segul read summary and --mode complete, and gives the same numbers.