
The summary classes can write charts, like the --plot option of the CLI, and return the paths of the files they write. PySEGUL can also load the JSON reports of these summaries as Python dictionaries.
Charts
Section titled “Charts”Pass PlotOptions as plot to any of these classes:
AlignmentSummary(not withper_locus=True)AlignmentDistanceReadSummaryContigSummaryMafSummary
Charts are written to the plots folder inside the output directory.
import pysegul
def summarize_with_charts():    plot = pysegul.PlotOptions(        format='svg',        palette='okabe-ito',        colormap='cividis',        )    summary = pysegul.AlignmentSummary('nexus', 'dna', 'tests/output', plot=plot)    outputs = summary.from_dir('tests/align-data')    print(outputs['plots'])
All chart options:
| Option | Default | Description |
|---|---|---|
format | 'png' | 'png', 'svg', or 'pdf' |
font | None | Font file for PNG and PDF text. Defaults to the system fonts |
palette | 'dark2' | 'dark2', 'okabe-ito', 'tol-bright', 'tol-muted', 'set2', 'paired', 'set1' |
colormap | 'viridis' | 'viridis', 'cividis', 'magma', 'inferno', 'plasma', 'blues', 'greens', 'ylgnbu', 'ylorrd', 'rdbu', 'puor', 'brbg' |
cvd | None | Simulate a color vision deficiency: 'protanopia', 'deuteranopia', 'tritanopia', 'achromatopsia' |
PNG and PDF charts need fonts. If none are found, PySEGUL raises a ValueError. Set font or use format='svg'.
Sample charts
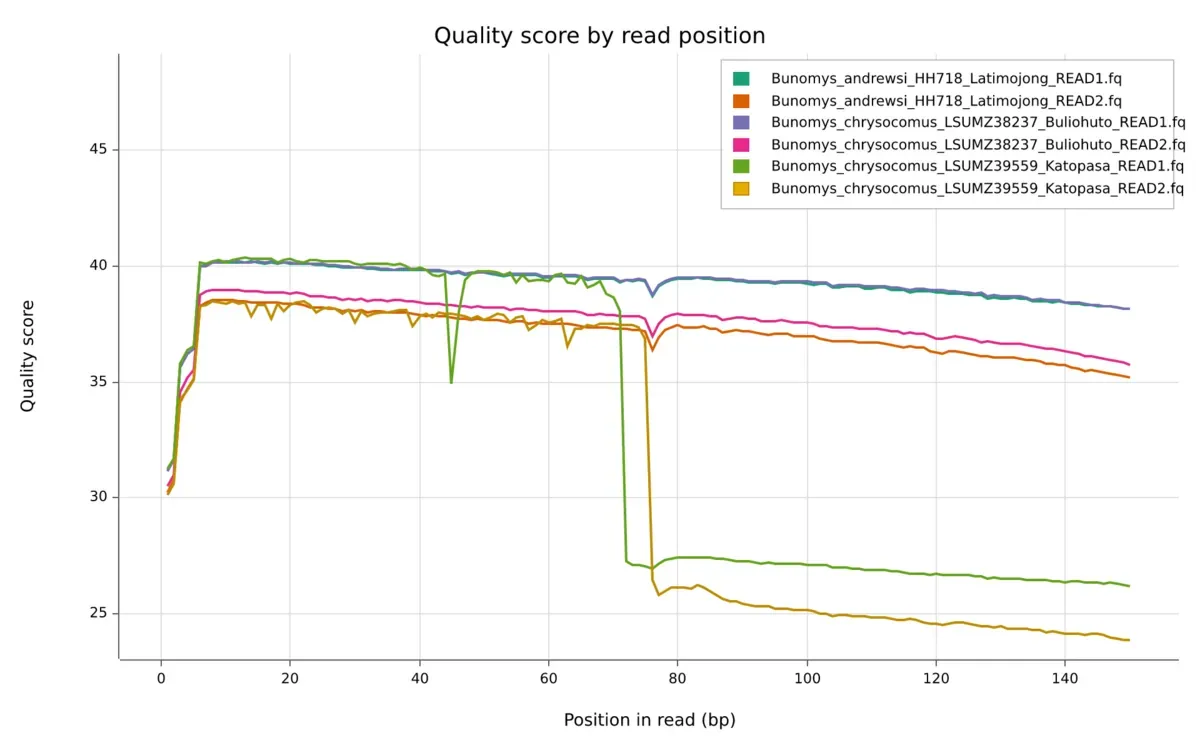
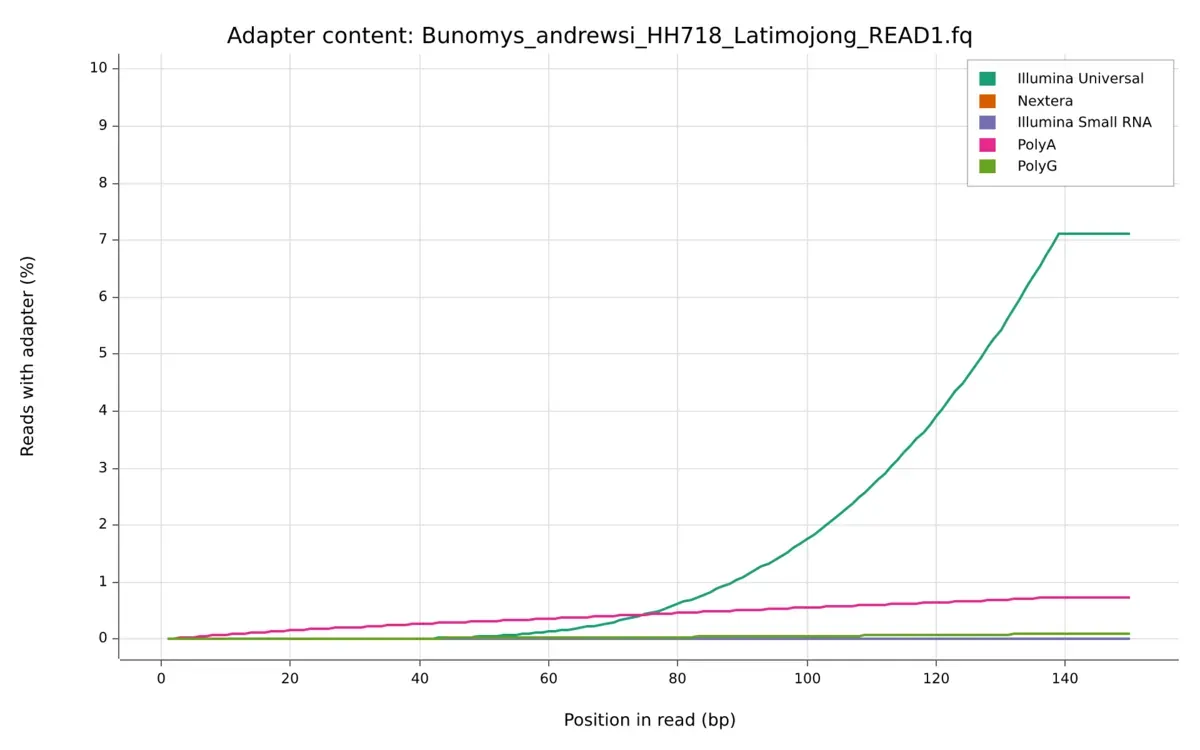
Section titled “Sample charts”These charts use the default options. The alignment charts come from 4,040 UCE loci of shrews (Esselstyn et al. 2021). The read charts come from raw Illumina reads of Bunomys rats.
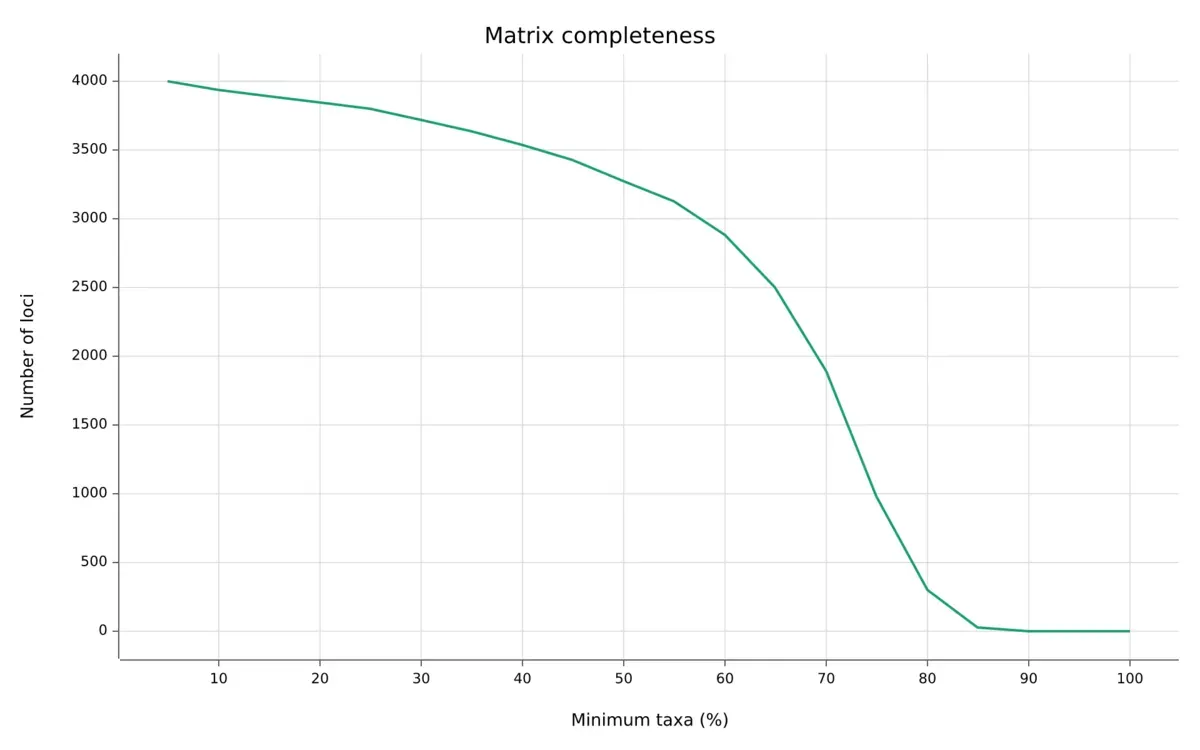
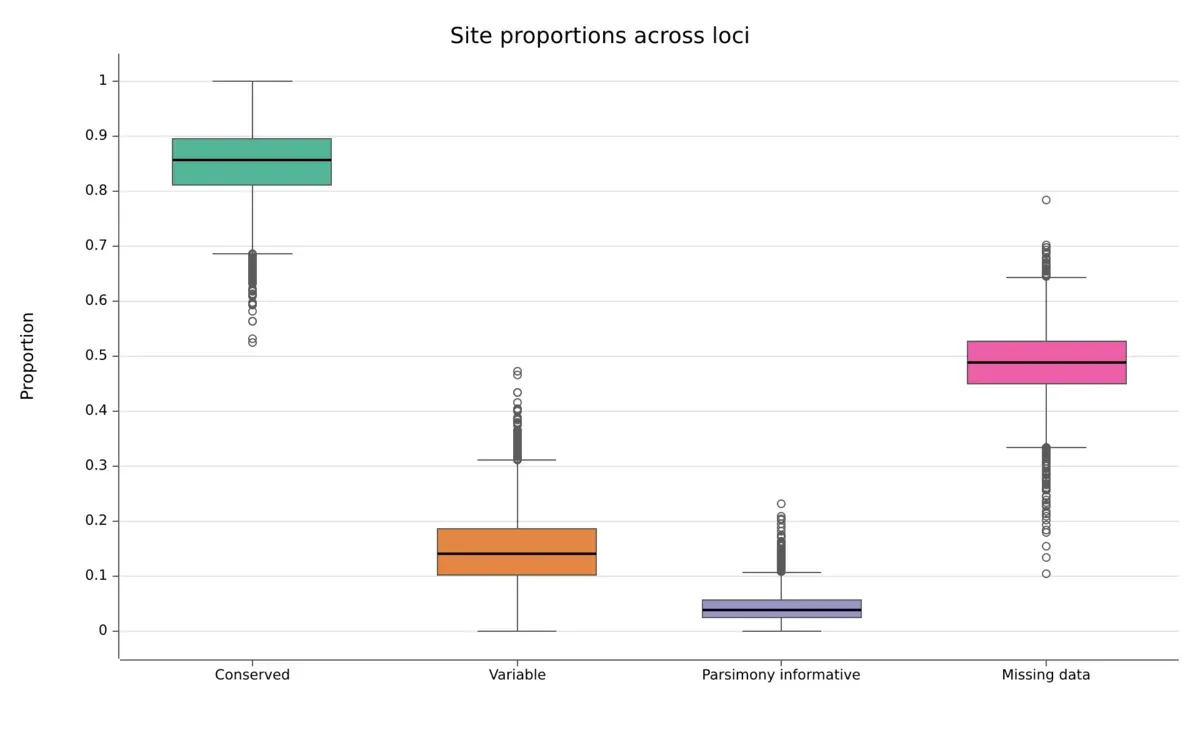
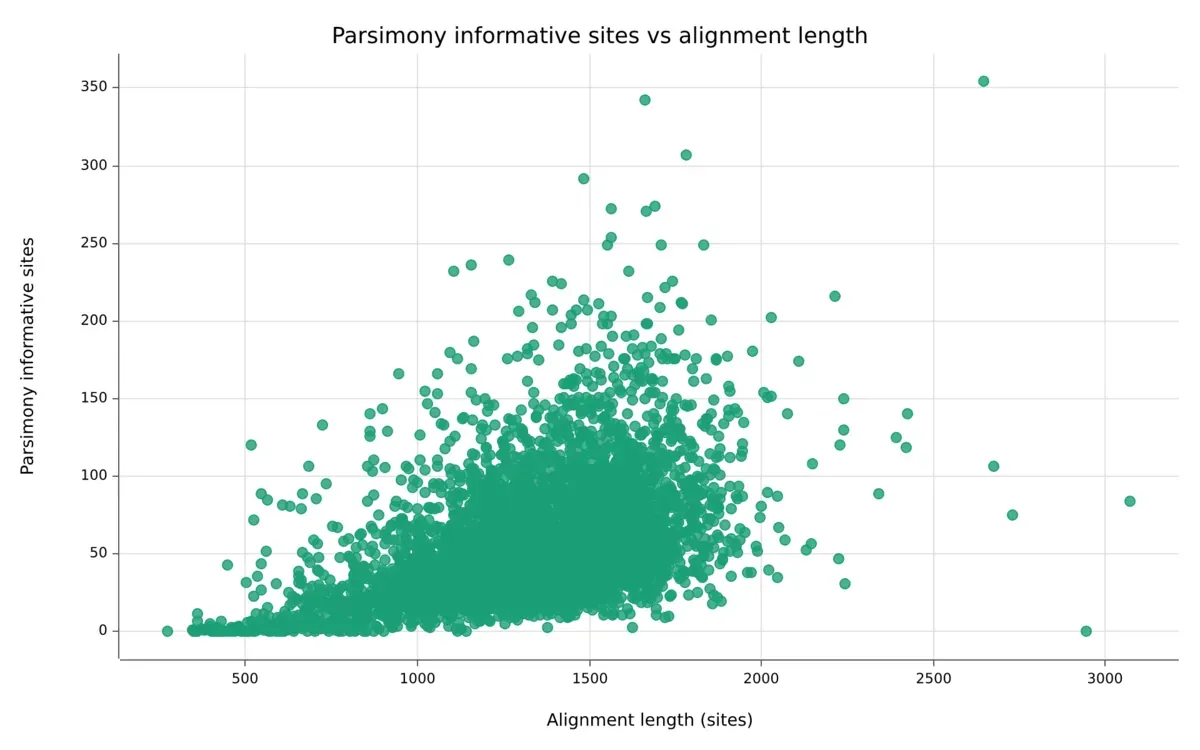
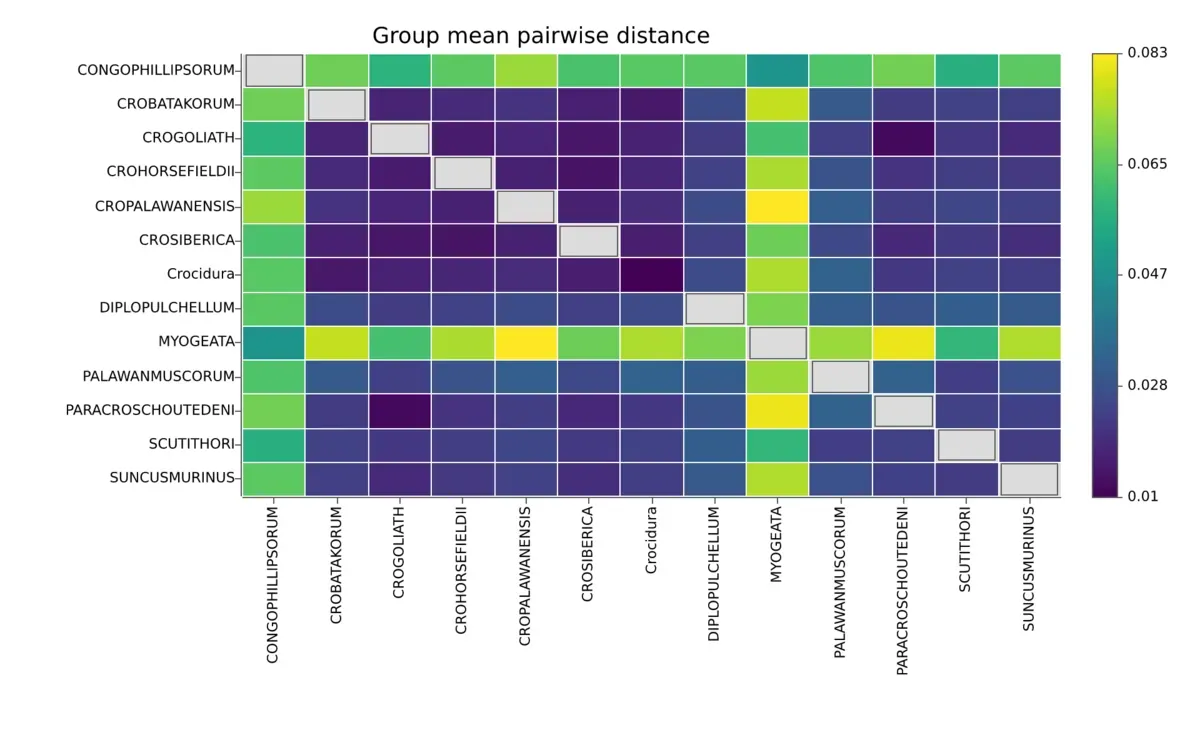
AlignmentDistance with group_by_delimiter('_', 1) also writes the mean distance between groups:
ReadSummary in complete mode writes charts for all samples and for each read file:
Output paths
Section titled “Output paths”The from_dir and from_files methods of the summary classes return a dictionary of output paths. Outputs that were not written are None. Every dictionary also has plots, a list of chart paths, which is empty without plot.
| Class | Keys |
|---|---|
AlignmentSummary | locus, taxon, text, report (empty dictionary with per_locus=True) |
AlignmentDistance | summary, per_locus_dir, group_mean, pairwise_long, report |
ReadSummary | summary, positions, distributions, report (complete mode only) |
ContigSummary | summary, report |
MafSummary | per_file, per_species |
MafConversion returns block and locus counts instead, such as blocks_read and loci_written.
Reports
Section titled “Reports”Load a JSON report as a dictionary:
| Function | Report |
|---|---|
load_align_report(path) | Alignment summary |
load_contig_report(path) | Contig summary |
load_distance_report(path) | Genetic distances |
load_read_report(path) | Read summary in complete mode |
import pysegul
def load_report():    summary = pysegul.ContigSummary('auto', 'tests/output')    outputs = summary.from_dir('tests/contig-data')    report = pysegul.load_contig_report(outputs['report'])    print(report.keys())
The read report also has the read quality checks for each sample. See Genomic Read Summary.