
Explore a summary report in your terminal, as tables or plots. It shows the same report SEGUI opens after a summary, so you can check results on a remote server or in a terminal session where a GUI is not available.
The viewer opens three reports:
alignment-report.json, written bysegul align summary.read-report.json, written bysegul read summary --mode complete.distance-report.json, written bysegul align distance.
SEGUL tells them apart from their content, so a report with an output prefix, such as uce_alignment-report.json, opens the same way:
segul view summary --input Align-Summary/alignment-report.jsonsegul view summary -i Read-Summary/read-report.jsonOther files stop with a message that names the file.
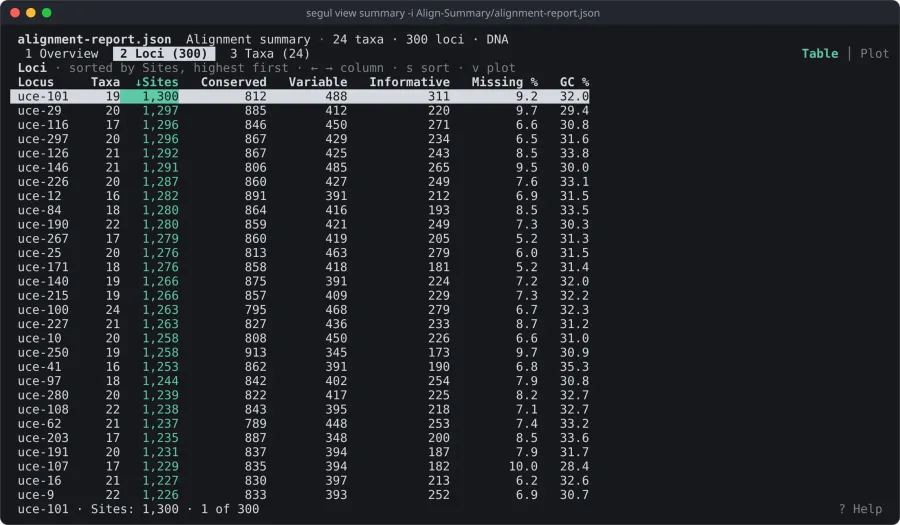
Layout
Section titled “Layout”From top to bottom, the viewer shows:
- Toolbar: the file name, the kind of report, and its main counts, such as
120 taxa · 4,060 loci · DNA. - Sections:
Overview, then one section for each kind of item. An alignment report hasLociandTaxa; a read report hasSamples; a distance report hasLoci,Samples,Groupswith grouping, and theMatrixandGroup matrixsections. Each section shows how many items it holds. On the right,Table │ Plotmarks the current view, and the plot shows whether it draws bars, a histogram, or a heatmap. - Section content: the overview, or the items of a section as a table or a plot.
- Status bar: the selected item, the chosen column and its value, and the item's position, such as
uce-12 · Sites: 412 · 12 of 4,060.
The viewer opens on the first table of items, the part most often wanted.
Overview
Section titled “Overview”The overview lists the totals of the report on the left, with bar charts on the right. Press 1 to open it, and Tab to go on to the tables.
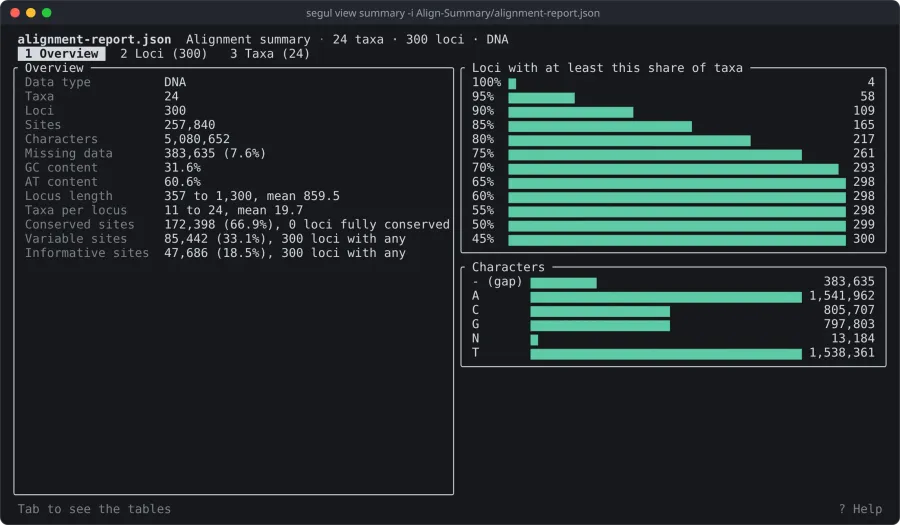
- Alignment report: the data type, taxa, loci, sites, characters, missing data, and GC and AT content, with the range and mean of locus length and taxa per locus. Conserved, variable, and parsimony informative sites show their count and share of all sites, with the loci that are fully conserved or have any variable or informative site. The charts show matrix completeness, as the loci with at least each share of taxa, and the count of each character.
- Read report: the samples, reads, bases, mean read length, and Q30 bases across every sample, with a chart of reads by mean quality score across all samples.
- Distance report: the data type, model, loci, samples, pairs, undefined pairs, the range, mean, and standard deviation of every pairwise distance, the median of the locus means, and the compared sites per pair, with a histogram of every pairwise distance across loci.
Tables and plots
Section titled “Tables and plots”Every section of items, such as Loci, Taxa, or Samples, can be shown as a table or a plot. Press v (or F2) to switch between them. Both follow the chosen column, so you can read the numbers in the table, then switch to the plot to see how they spread.
Read a table
Section titled “Read a table”The table has one row per item and one column per statistic.
- Press
Tab, or the section number, such as2forLoci, to open a section. - Press
←or→to choose a column. Its header is highlighted, and light lines separate the columns. Columns that do not fit the terminal scroll into view as you move to them, and the title says how many are hidden. - Press
↑or↓to select an item. The status bar shows its name, the chosen column and its value, and its position. - Press
sto sort by the chosen column, highest first. Press it again to sort lowest first, and once more to return to the report order. An arrow next to the column name shows the order.
The selected item stays selected when you sort, so the table may scroll to keep it in view. Press Home to go back to the first item. Items without a value, such as duplication from a Default mode run, go last.
Plot a column
Section titled “Plot a column”Press v in a table to plot the chosen column. The plot draws one bar per item, in the same order as the table, with the minimum, median, and maximum in the title. Sort the table first to rank the items, as in this plot of the loci with the most sites:
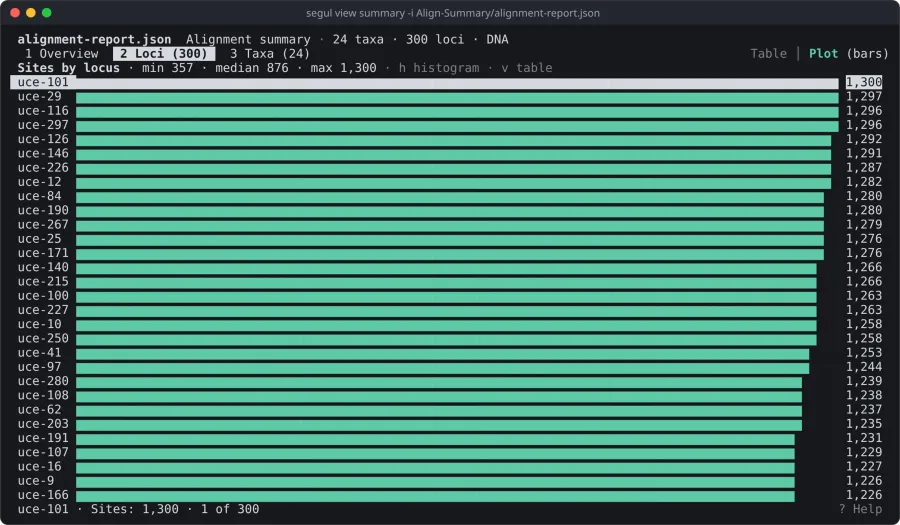
Press ← or → to plot another column, and ↑ or ↓ to move the selection. Press v again to return to the table.
Show a histogram
Section titled “Show a histogram”Press h in the plot to count the items in ranges of the chosen column instead. Each bar shows how many items fall in its range. The range of the selected item is highlighted, and a note below the chart names it. Press h again for a heatmap.
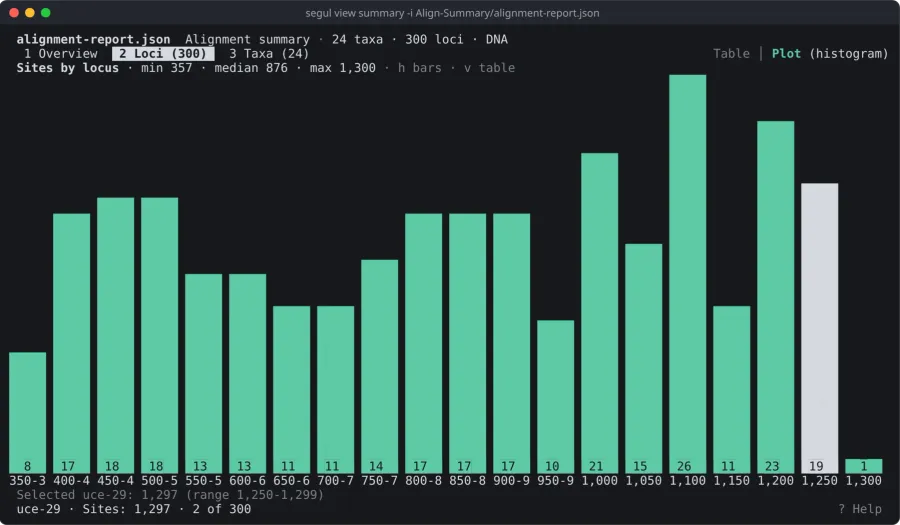
The plot remembers the choice, so other columns also open as a histogram until you press h again.
Show a heatmap
Section titled “Show a heatmap”Press h once more to draw every column as a heatmap, one row per item in the table order. Each column is colored from its lowest to its highest value, and missing values show as ·. The line below the heatmap shows the colors from low to high and the selected item's value in the chosen column. Choose the colors with --colormap. Press h again to return to the bars.
Columns
Section titled “Columns”Alignment reports have these columns:
- Loci: taxa, sites, conserved, variable, and parsimony informative sites, missing data (%), and GC content (%) for DNA.
- Taxa: loci the taxon appears in, characters, missing characters, missing data (%), and GC content (%) for DNA.
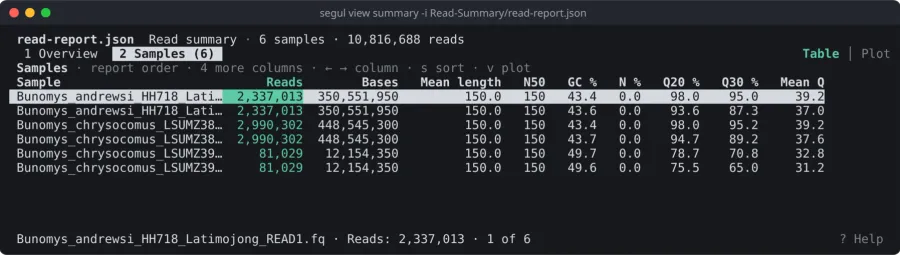
Read reports list each sample's reads, bases, mean read length, N50, GC content, N content, Q20 and Q30 bases, mean quality, and reads with mean quality below 20. Duplication, adapters, and poly-G appear when the report has them.
Distance reports have these columns:
- Loci: samples, sites, pairs, undefined pairs, the mean, median, standard deviation, minimum, and maximum distance, and the mean compared sites per pair.
- Samples: loci, pairs, and the mean, standard deviation, minimum, and maximum distance to every other sample.
Nearestis the distance to the nearest sample. With groups,Max withinandMin betweenare the highest distance to a sample of the same group and the lowest to another group. - Groups: samples, pairs within the group, the mean, standard deviation, and maximum distance within the group, and the mean distance to the nearest group.
Matrices
Section titled “Matrices”A distance report also has a Matrix section with the mean distance between every pair of samples, and a Group matrix section with the mean distance within and between groups. Rows are named, and columns are numbered by row. Press the arrow keys to move between cells; the status bar names the two items and their distance. Cells are colored from the lowest to the highest distance, leaving out each item with itself. Missing values show as ·.
Key bindings
Section titled “Key bindings”Press F1 or ? in the viewer to see them.
| Keys | Action |
|---|---|
Tab / Shift+Tab | Next / previous section |
1 to 9 | Go to a section |
v or F2 | Switch between table and plot |
h | Cycle the plot: bars, histogram, heatmap |
← / → | Choose a column |
s | Sort by the column: highest first, lowest first, report order |
↑ / ↓ | Move the selection |
| Arrows in a matrix | Move between cells |
PgUp / PgDn | Move a page (fn+↑ / fn+↓ on macOS) |
Home / End | First / last item (fn+← / fn+→ on macOS) |
| Mouse wheel | Scroll |
F1 or ? | Show the key bindings |
q, Esc, or Ctrl+C | Quit |
All options
Section titled “All options”| Option | Description |
|---|---|
-i, --input | alignment-report.json from segul align summary, read-report.json from segul read summary --mode complete, or distance-report.json from segul align distance |
--theme | Colors for a dark (default) or light terminal |
--colormap | Heatmap colors: viridis (default), cividis, magma, inferno, plasma, blues, greens, ylgnbu, ylorrd, rdbu, puor, or brbg |
--log | Log file path. Default: segul.log |